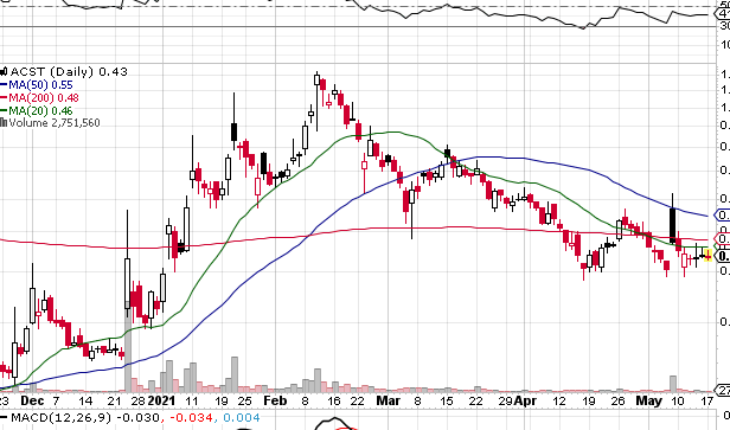
Acasti Pharma Inc (NASDAQ:ACST) is trading in a narrow range on Monday on very light volume. The stock looks as if its lost steam and is about to head lower.
Market Action
ACST stock closed up a touch Monday at .4396. 3.3 million shares changed hands on 5574 trades. The stock opened at $0.4332 and moved within a narrow range of 0.4253-0.4489.
ACST Requests Hearing
Acasti Intends to Request Hearing Before Nasdaq Panel to Present Plan of Compliance
- ACST announced that, on May 11, 2021, the Company received notice from the Nasdaq Listing Qualifications Department (the “Staff”) indicating that, based upon the Company’s non-compliance with the $1.00 bid price requirement set forth in Nasdaq Listing Rule 5550(a) (the “Rule”) as of May 10, 2021, the Company’s securities were subject to delisting unless the Company timely requests a hearing before the Nasdaq Hearings Panel (the “Panel”).
- The Company has previously disclosed and expected such notification from Nasdaq and believes it has options to regain compliance, preferably in connection with its proposed acquisition of Grace Therapeutics, Inc. (“Grace”) as is often done in connection with similar transactions.
- The Company plans to timely request a hearing, which will stay any further action by Nasdaq pending the conclusion of the hearing process.
- Importantly, Acasti is prepared to take definitive action to regain compliance with the Rule and otherwise ensure the Company’s continued listing on Nasdaq.
Share Information
Trader Notes
| SHARES OUTSTANDING | 208.38 M |
| SHARE FLOAT (%) | 207.83 M (99.74%) |
| % HELD BY INSTITUTIONS | 0.97 |
Recent Stock Performance
| 5-DAY PERF. | -3.44% |
| 1-MONTH PERF. | +6.76% |
| 3-MONTH PERF. | -57.40% |
| 6-MONTH PERF. | +106.90% |
| YTD PERF. | +33.69% |
| 1-YEAR PERF. | -30.49% |
Moving Averages
| +/- EMA(20) | 0.46 (-6.52%) |
| +/- SMA(50) | 0.55 (-21.82%) |
| +/- SMA(200) | 0.48 (-10.42%) |
Pivot Points
| Name | S3 | S2 | S1 | Pivot Points | R1 | R2 | R3 |
| Classic | 0.3990 | 0.4152 | 0.4256 | 0.4418 | 0.4522 | 0.4684 | 0.4788 |
| Fibonacci | 0.4152 | 0.4254 | 0.4316 | 0.4418 | 0.4520 | 0.4582 | 0.4684 |
Technical Indicators
| Symbol | Value | Result | Symbol | Value | Result |
| ADX | 27.5368 | Sell | ATR14 | 0.0646 | |
| CCI20 | -45.0708 | Neutral | Chaikin Money Flow | -0.3934 | Sell |
| MACD | -0.0451 | Sell | Money Flow Index | 63.8233 | Buy |
| ROC | -14.5601 | Sell | RSI | 43.9290 | Sell |
| STOCH (14,3) | 20.0174 | Buy | STOCH RSI | 0.6013 | Neutral |
| UO | 37.3792 | Buy | Williams %R | -79.9826 | Neutral |


