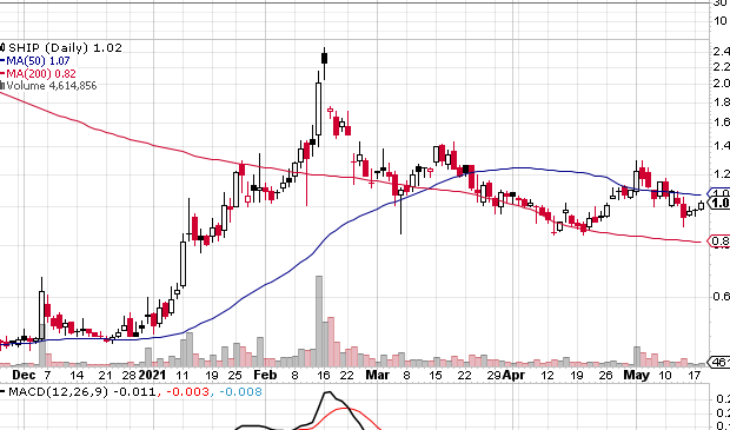
Following a 70% fall since February, Seanergy Maritime Holdings Corp. (NASDAQ: SHIP) is consolidating over the past few trading sessions. It looks like SHIP could rally here a bit.
Market Action
SHIP stock closed higher by 4.19% to close at $1.302 on Tuesday. Total volume was 4.62 million shares, below its average volume of 11.06 million shares. The stock opened at $0.99 and moved in a range of $0.9810 – 1.0350.
SHIP Issued News in Early May
May 06, 2021 – Seanergy Maritime Holdings Corp. Announces Delivery of Capesize M/V Hellasship and Time Charter Agreement with NYK Line
- SHIP announced on May 06, 2021 that it has taken delivery of the 181,325 dwt Capesize bulk carrier, built in 2012 by Imabari Shipbuilding Co. in Japan, which was renamed M/V Hellasship (the “Vessel”). The delivery of the M/V Hellasship is the first of the four Capesize acquisitions performed already in 2021.
- The Vessel has been fixed on a time charter (“T/C”) with NYK Line, a leading Japanese shipping company and operator.
- The T/C is expected to commence immediately, upon finalization of the customary transition process and will have a term of minimum 11 to maximum 15 months from the delivery. The gross daily rate of the T/C is based at a premium over the Baltic Capesize Index (“BCI”).
“We are pleased to announce the well-timed delivery of our twelfth cape vessel, during the strongest Capesize market of the last decade with spot rates standing currently above $42,000 per day. This delivery is the first of the four acquisitions we agreed so far in 2021, before the impressive surge in freight day rates and asset values. Needless to say, that our timing has been once again optimal.
Trader Notes
Share Information
| SHARES OUTSTANDING | 156.18 M |
| SHARE FLOAT (%) | 147.12 M (94.20%) |
| % HELD BY INSTITUTIONS | 1.92 |
Recent Stock Performance
| 5-DAY PERF. | -6.42% |
| 1-MONTH PERF. | +12.05% |
| 3-MONTH PERF. | -32.00% |
| 6-MONTH PERF. | +129.21% |
| YTD PERF. | +89.73% |
| 1-YEAR PERF. | -56.93% |
Moving Averages
| +/- EMA(20) | 1.04 (-1.92%) |
| +/- SMA(50) | 1.11 (-8.11%) |
| +/- SMA(200) | 0.77 (+32.47%) |
Pivot Points
| Name | S3 | S2 | S1 | Pivot Points | R1 | R2 | R3 |
| Classic | 0.9350 | 0.9580 | 0.9890 | 1.0120 | 1.0430 | 1.0660 | 1.0970 |
| Fibonacci | 0.9580 | 0.9786 | 0.9914 | 1.0120 | 1.0326 | 1.0454 | 1.0660 |
Technical Indicators
| Symbol | Value | Result | Symbol | Value | Result |
| ADX | 25.7130 | Buy | ATR14 | 0.1101 | |
| CCI20 | -36.1617 | Neutral | Chaikin Money Flow | -0.0784 | Sell |
| MACD | -0.0236 | Sell | Money Flow Index | 54.8300 | Sell |
| ROC | -7.2727 | Sell | RSI | 49.8301 | Buy |
| STOCH (14,3) | 31.7073 | Sell | STOCH RSI | 0.6044 | Buy |
| UO | 44.1960 | Sell | Williams %R | -68.2927 | Neutral |


