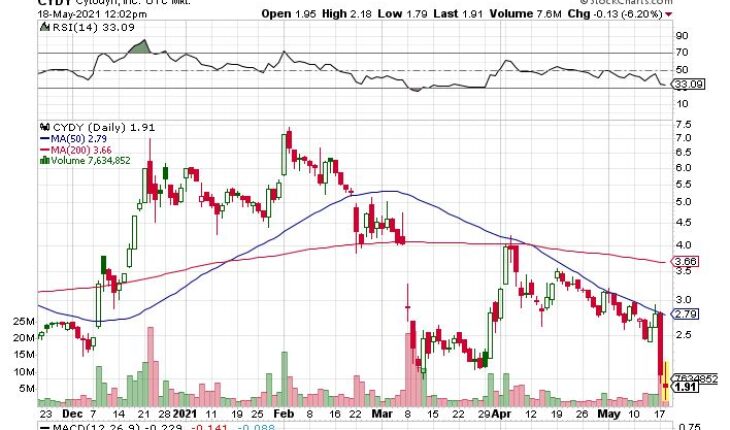
After opening, CytoDyn Inc. (OTCMKTS:CYDY) has been moving in a narrow range. Will it continue to fall?
Market Action
As of 12:43, CYDY is trading flat at $1.88. Volume 8.593 million shares, double the 30-day average volume. CYDY opened at $1.95 and has ranged between $1.79 and $2.18.
CYDY Will Publish Results Of Its CD12 Phase 3 Clinical Trial
- CytoDyn announced today that it will publish the results of its newly completed top-line report of its CD12 phase 3 clinical trial data for severe to critical patients to various agencies including India and the Philippines.
- The results were measured for 28 days. From day zero to seven patients receiving leronlimab experienced a mortality rate of 78% and patients receiving the second dose achieved a maximum benefit of 82% less mortality.
- A total of two doses were given to the patients in the CD12 trial.
Trader Notes
Share Information
| SHARES OUTSTANDING | 612.88 M |
| SHARE FLOAT (%) | 550.66 M (89.85%) |
| % HELD BY INSTITUTIONS | 0.13 |
Recent Stock Performance
| 5-DAY PERF. | -30.77% |
| 1-MONTH PERF. | -42.38% |
| 3-MONTH PERF. | -64.80% |
| 6-MONTH PERF. | -23.17% |
| YTD PERF. | -64.94% |
| 1-YEAR PERF. | -39.61% |
Moving Averages
| +/- EMA(20) | 2.72 (-29.41%) |
| +/- SMA(50) | 2.79 (-31.18%) |
| +/- SMA(200) | 3.66 (-47.54%) |
Pivot Points
| Name | S3 | S2 | S1 | Pivot Points | R1 | R2 | R3 |
| Classic | 0.8533 | 1.4067 | 1.7233 | 2.2767 | 2.5933 | 3.1467 | 3.4633 |
| Fibonacci | 1.4067 | 1.7390 | 1.9443 | 2.2767 | 2.6090 | 2.8143 | 3.1467 |
Technical Indicators
| Symbol | Value | Result | Symbol | Value | Result |
| ADX | 20.0595 | Neutral | ATR14 | 0.3425 | |
| CCI20 | -190.6631 | Sell | Chaikin Money Flow | -0.2744 | Sell |
| MACD | -0.3589 | Sell | Money Flow Index | 39.1803 | Buy |
| ROC | -26.8817 | Sell | RSI | 30.2122 | Sell |
| STOCH (14,3) | 6.4516 | OverSold | STOCH RSI | 0.0000 | OverSold |
| UO | 36.4844 | Sell | Williams %R | -93.5484 | OverSold |


