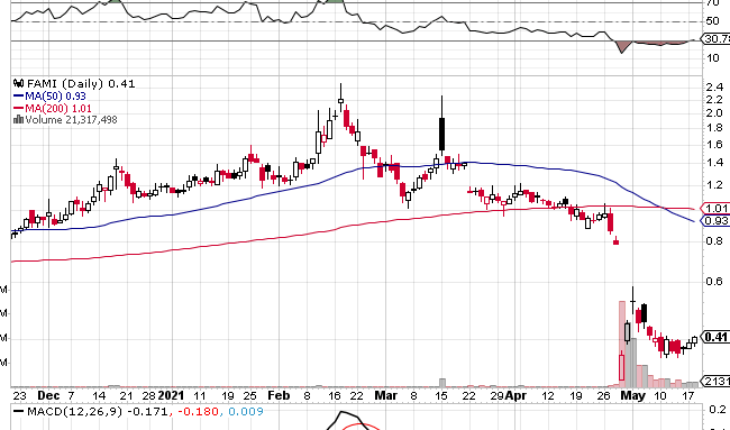
Farmmi Inc (NASDAQ:FAMI) has been moving within a narrow over the past few trading sessions, following the steep drop at the end of March.
Market Action
On Tuesday, FAMI stock traded up a bit gaining 4.24% to close at $0.41. Total volume was 21.31 million shares, at par its average volume of 21.94 million shares. The stock opened at $0.39 and moved in a range of $0.3815 – 0.4080.
FAMI’s Recent News
On, May 13, 2021, the company released news:
Farmmi Announces Latest Sales Win; Continues to Benefit from Increased Worldwide Demand for Mushrooms
- FAMI announced its latest sales win underscoring the continued growth in worldwide demand for mushrooms.
- The Company’s Zhejiang Forest Food Co., Ltd. subsidiary was awarded another multi-product order for export to Israel. This latest order is for dried whole and sliced Shiitake mushrooms, and dried black fungus.
Ms. Yefang Zhang, Farmmi’s Chairwoman and CEO, commented, “We are benefiting from increased customer engagements worldwide. Investments we made in building out our supply chain, warehousing, packaging and logistics are giving Farmmi an advantaged competitive position. Our ability to source high-quality mushrooms and edible fungi from major suppliers sets us apart.
Trader Notes
Share Information
| SHARES OUTSTANDING | 363.88 M |
| SHARE FLOAT (%) | 300.29 M (82.52%) |
| % HELD BY INSTITUTIONS | 9.07 |
Recent Stock Performance
| 5-DAY PERF. | -17.93% |
| 1-MONTH PERF. | -26.37% |
| 3-MONTH PERF. | -46.28% |
| 6-MONTH PERF. | +459.63% |
| YTD PERF. | +36.35% |
| 1-YEAR PERF. | +847.46% |
Moving Averages
| +/- EMA(20) | 3.08 (-16.23%) |
| +/- SMA(50) | 3.47 (-25.65%) |
| +/- SMA(200) | 1.84 (+40.22%) |
Pivot Points
| Name | S3 | S2 | S1 | Pivot Points | R1 | R2 | R3 |
| Classic | 0.3622 | 0.3718 | 0.3887 | 0.3983 | 0.4152 | 0.4248 | 0.4417 |
| Fibonacci | 0.3718 | 0.3820 | 0.3882 | 0.3983 | 0.4085 | 0.4147 | 0.4248 |
Technical Indicators
| Symbol | Value | Result | Symbol | Value | Result |
| ADX | 25.6785 | Sell | ATR14 | 0.0913 | |
| CCI20 | -50.7112 | Sell | Chaikin Money Flow | 0.2381 | Buy |
| MACD | -0.1935 | Sell | Money Flow Index | 57.0708 | Buy |
| ROC | -9.0807 | Sell | RSI | 33.0342 | Buy |
| STOCH (14,3) | 38.0986 | Buy | STOCH RSI | 1.0000 | OverBought |
| UO | 43.0824 | Buy | Williams %R | -61.9014 | Neutral |


