Oncolytics Biotech Inc. (NASDAQ:ONCY) is moving up in the pre-open session on Thursday after announcing the news.
Market Action
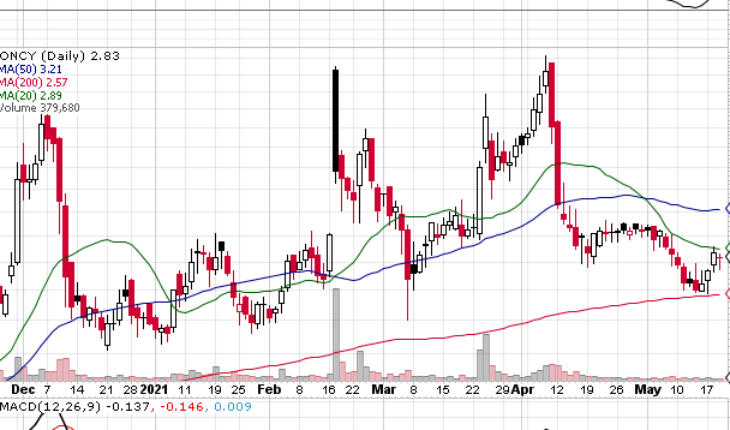
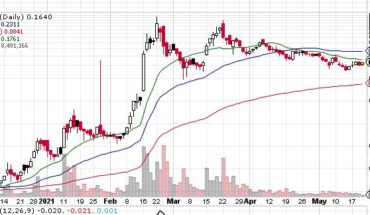
As of 7:25, ONCY stock is up by $0.11 or 3.89% to $2.94. So far more than 30K shares have exchanged hands.
ONCY Announces Clinical and Biomarker Data
Oncolytics Biotech® Announces Clinical and Biomarker Data Demonstrating Clinical Proof-of-Concept for Pelareorep-Checkpoint Inhibitor Combination in Pancreatic Cancer
- ONCY announced clinical and biomarker data demonstrating clinical proof-of-concept for pelareorep-checkpoint inhibitor combination therapy in pancreatic cancer.
- The data will be featured in an upcoming electronic poster presentation at the 2021 American Society of Clinical Oncology (ASCO) Annual Meeting, which is taking place virtually from June 4 – 8, 2021.
- The newly announced data are from a phase 2 trial evaluating pelareorep in combination with the PD-1 inhibitor pembrolizumab (KEYTRUDA®) in pancreatic adenocarcinoma patients who progressed after first-line treatment.
- Findings from the trial indicate that pelareorep and pembrolizumab synergize and show anti-cancer activity in these difficult-to-treat patients, which is mediated through the complementary immunotherapeutic effects of the two agents.
“These results are very promising, particularly considering the extremely challenging patient population enrolled in the trial. That we saw a response signal in select patients, despite the absence of chemotherapy, provides evidence of the considerable anti-cancer activity of pelareorep-pembrolizumab combination therapy,” said Principal Investigator, Devalingam Mahalingam, M.D., Ph.D., Associate Professor of Medicine at The Northwestern University Feinberg School of Medicine and a member of the Robert H. Lurie Comprehensive Cancer Center of Northwestern University.
Trader Notes
Share Information
| SHARES OUTSTANDING | 54.67 M |
| SHARE FLOAT (%) | 53.89 M (98.58%) |
| % HELD BY INSTITUTIONS | 2.12 |
Recent Stock Performance
| 5-DAY PERF. | +6.79% |
| 1-MONTH PERF. | -1.39% |
| 3-MONTH PERF. | -16.52% |
| 6-MONTH PERF. | +36.71% |
| YTD PERF. | +18.91% |
| 1-YEAR PERF. | +9.69% |
Moving Averages
| +/- EMA(20) | 2.90 (-2.41%) |
| +/- SMA(50) | 3.21 (-11.84%) |
| +/- SMA(200) | 2.57 (+10.12%) |
Pivot Points
| Name | S3 | S2 | S1 | Pivot Points | R1 | R2 | R3 |
| Classic | 2.6567 | 2.7033 | 2.7667 | 2.8133 | 2.8767 | 2.9233 | 2.9867 |
| Fibonacci | 2.7033 | 2.7454 | 2.7713 | 2.8133 | 2.8554 | 2.8813 | 2.9233 |
Technical Indicators
| Symbol | Value | Result | Symbol | Value | Result |
| ADX | 18.9594 | Neutral | ATR14 | 0.1904 | |
| CCI20 | -40.1974 | Neutral | Chaikin Money Flow | -0.0300 | Neutral |
| MACD | -0.0740 | Sell | Money Flow Index | 25.9474 | Sell |
| ROC | -7.2131 | Sell | RSI | 40.6711 | Buy |
| STOCH (14,3) | 49.0196 | Buy | STOCH RSI | 0.9076 | OverBought |
| UO | 44.9078 | Sell | Williams %R | -50.9804 | Neutral |
