Color Star Technology Co Ltd (NASDAQ:CSCW) is moving up in early session on Thursday.
Market Action
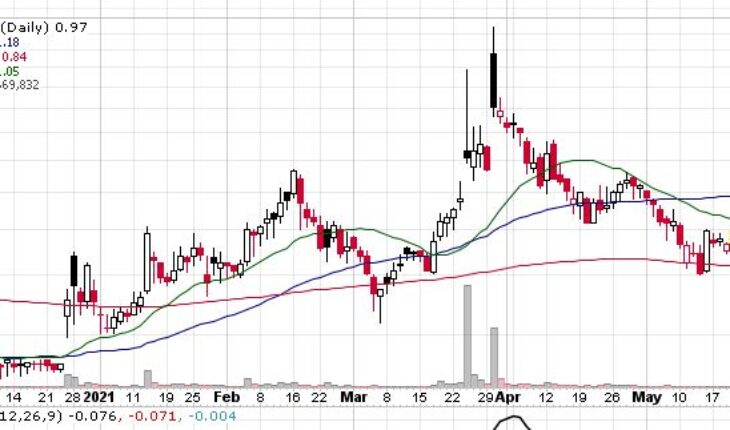
As of 10:13, CSCW stock went up by over 4.50% to $0.97. The stock has traded 685K shares, compared to its average volume of 17.80 million shares. The stock opened at $0.952 and moved in a range of $0.9400 – 0.9850.
CSCW Releases News Today
Color Star Technology Co., Ltd. Announces Memorandum of Understanding with Movie Planet LLC and Youa Group to Launch Joint Development of Non-Fungible Token (NFT) for Film Databases
- CSCW announced the signing of a Memorandum of Understanding (“MOU”) on April 23 through its wholly-owned subsidiary, Color China Entertainment Co., Ltd., Movie Planet LLC (hereinafter referred to as “Movie Planet”), and a South Korea-based company, Youa Group (hereinafter referred to as “Youa Group”).
- Pursuant to the MOU and subject to definitive agreements, the three parties will aim to jointly develop a NFT application for the Hollywood Film Festival and International Film Festival databases.
- Movie Planet is a Hollywood-based company that focuses on the development of film copyrights. It currently owns the copyrights of many international award-winning films. It also holds large-scale international film exhibitions and has good relationships with the world’s top film actors, film production teams, and screenwriter teams. Youa Group is a global blockchain firm.
Mr. Luke Lu, Color Star’s CEO, commented: “We look forward to finalizing the cooperation with Movie Planet and Youa Gorup. The opportunity to work with a top Hollywood entertainment company and a Korean technology company will accelerate our own technology developments. The discussion about exchange and profit realization of entertainment copyrights have been going on for a long time in the industry. The cooperation among us will be a benchmark, and I believe our future product will soon be available to the public.”
Trader Notes
Share Information
| SHARES OUTSTANDING | 28.85 M |
| SHARE FLOAT (%) | 20.75 M (71.92%) |
| % HELD BY INSTITUTIONS | 1.91 |
Recent Stock Performance
| 5-DAY PERF. | +19.68% |
| 1-MONTH PERF. | -5.99% |
| 3-MONTH PERF. | -6.89% |
| 6-MONTH PERF. | +94.05% |
| YTD PERF. | +37.54% |
| 1-YEAR PERF. | +126.03% |
Moving Averages
| +/- EMA(20) | 1.03 (-5.83%) |
| +/- SMA(50) | 1.18 (-17.80%) |
| +/- SMA(200) | 0.84 (+15.48%) |
Pivot Points
| Name | S3 | S2 | S1 | Pivot Points | R1 | R2 | R3 |
| Classic | 0.8516 | 0.8703 | 0.8995 | 0.9182 | 0.9474 | 0.9661 | 0.9953 |
| Fibonacci | 0.8703 | 0.8886 | 0.8999 | 0.9182 | 0.9365 | 0.9478 | 0.9661 |
Technical Indicators
| Symbol | Value | Result | Symbol | Value | Result |
| ADX | 42.6181 | Sell | ATR14 | 0.1244 | |
| CCI20 | -79.9429 | Sell | Chaikin Money Flow | 0.1036 | Buy |
| MACD | -0.1009 | Sell | Money Flow Index | 24.2495 | Sell |
| ROC | -20.6325 | Sell | RSI | 38.6755 | Sell |
| STOCH (14,3) | 28.5619 | Buy | STOCH RSI | 0.8277 | OverBought |
| UO | 53.2268 | Buy | Williams %R | -71.4381 | Neutral |


