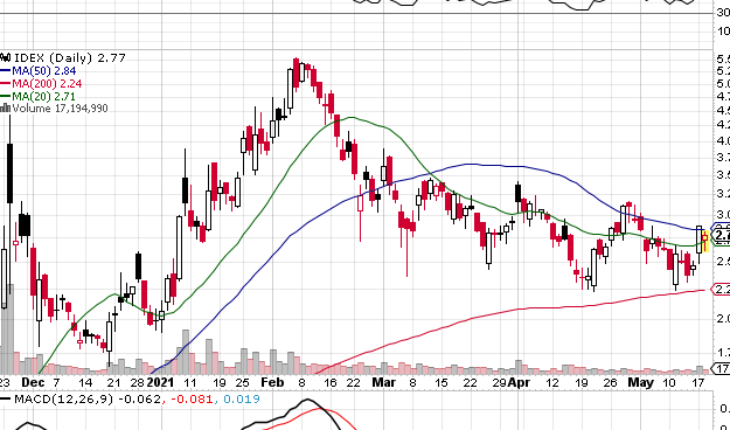
Ideanomics Inc (NASDAQ: IDEX) is correcting this morning following a 17% jump in yesterday’s trading session. The stock is nearing a declining trend line along the highs over the last 3 months. If IDEX can close above 3.00 over the next few days there may be some upside ahead.
Market Action
As of 12.41, IDEX stock fell 3.47% to $2.78. The stock has seen a total volume of 18.20 million shares. The stock opened at $2.72 and moved in a range of $2.6100 – 2.8100.
IDEX Issues Q1 Earnings
Ideanomics, Inc. Reports Q1 2021 Financial Results
- Revenue for the quarter ended March 31, 2021, was $32.7 million and gross profit of $10.8 million.
- First revenues from WAVE – Ideanomics’ inductive charging business and from Timios, our Title and escrow services company – both businesses were acquired in January 2021
- $356 million cash at quarter end providing a deep pool of capital for investment in our Ideanomics Mobility & Capital business units
- Gross profit for first quarter 2021 was $10.8 million which represented a Gross Margin of 33.1%. Gross profit for first quarter 2020 was $44,000.
“Ideanomics is transforming dramatically quarter over quarter,” said Alf Poor, CEO of Ideanomics. “I am both pleased and proud to say that as is stands today the company is the healthiest it has been in close to three years that I have been on board.”
Trader Notes
Share Information
| SHARES OUTSTANDING | 419.32 M |
| SHARE FLOAT (%) | 372.77 M (88.90%) |
| % HELD BY INSTITUTIONS | 3.59 |
Recent Stock Performance
| 5-DAY PERF. | +7.36% |
| 1-MONTH PERF. | +15.90% |
| 3-MONTH PERF. | -25.74% |
| 6-MONTH PERF. | +138.79% |
| YTD PERF. | +39.20% |
| 1-YEAR PERF. | +477.08% |
Moving Averages
| +/- EMA(20) | 2.68 (+3.36%) |
| +/- SMA(50) | 2.84 (-2.46%) |
| +/- SMA(200) | 2.24 (+23.66%) |
Pivot Points
| Name | S3 | S2 | S1 | Pivot Points | R1 | R2 | R3 |
| Classic | 219.0400 | 220.2200 | 222.0300 | 223.2100 | 225.0200 | 226.2000 | 228.0100 |
| Fibonacci | 220.2200 | 221.3622 | 222.0678 | 223.2100 | 224.3522 | 225.0578 | 226.2000 |
Technical Indicators
| Symbol | Value | Result | Symbol | Value | Result |
| ADX | 8.0431 | Neutral | ATR14 | 4.2014 | |
| CCI20 | -77.2869 | Sell | Chaikin Money Flow | -0.1622 | Sell |
| MACD | 3.4144 | Buy | Money Flow Index | 50.4441 | Sell |
| ROC | -1.8891 | Sell | RSI | 51.7383 | Buy |
| STOCH (14,3) | 32.6934 | Neutral | STOCH RSI | 0.5750 | Neutral |
| UO | 43.9411 | Sell | Williams %R | -67.3066 | Neutral |


